Create a visualization of the data for the TDoR 2019 period #5
Description
TDoR 2019 commemorates people that have died in the period 1 October 2018 and 30 September 2019.
Some examples:
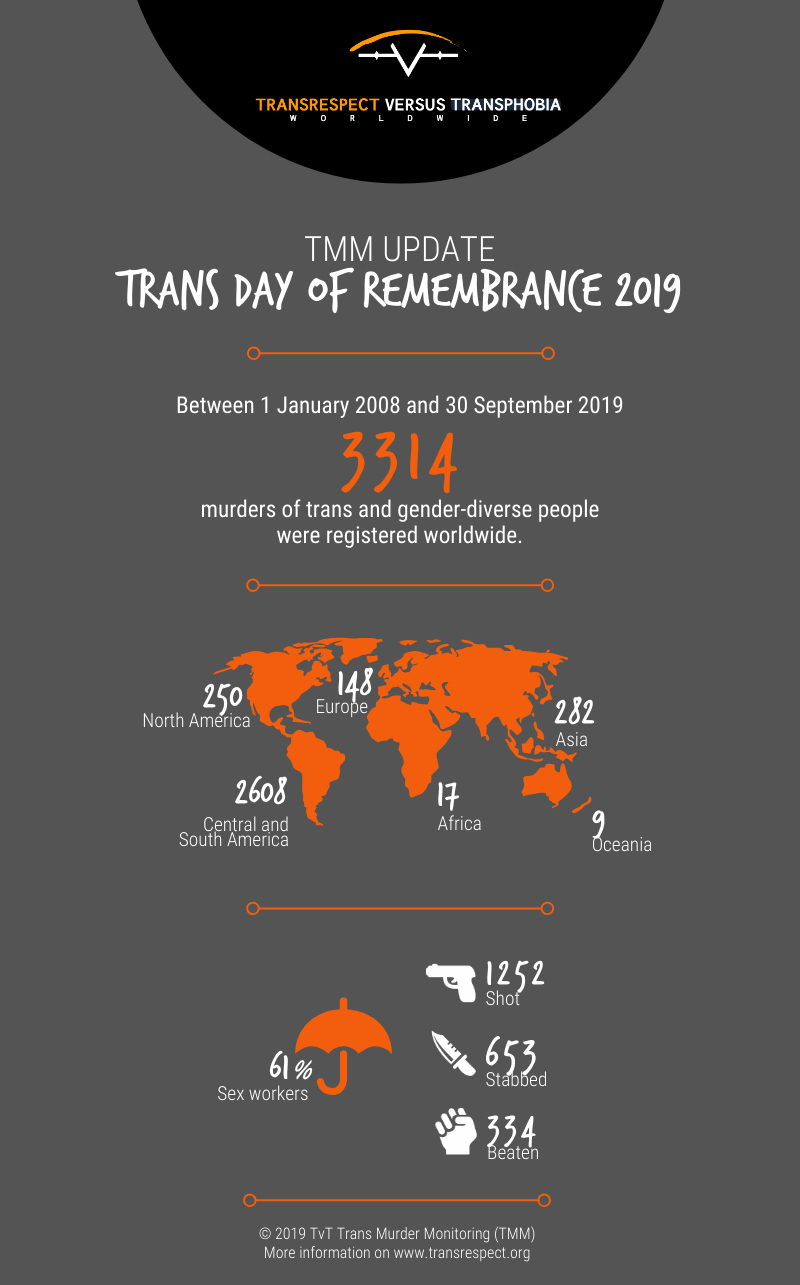
Infographic - summary statistics + global map, totals deaths registered from 1 Jan 2008 to 30 Sep 2019
https://transrespect.org/wp-content/uploads/2019/11/TvT_TMM_TDoR2019_Infographics_EN.jpg
Static visualization - names of those who died, by continent (for TDoR 2018 period?)
https://twitter.com/shohct/status/1065494393031876608?s=20
(also as a gif: https://twitter.com/shohct/status/1065494390984953856?s=20)
Static US map - names and locationsof deaths in the continental US, TDoR 2018
https://twitter.com/LizEisenhauer/status/1065138505033093122?s=20
Interactive visualization - a candle for each death during TDoR 2018 with links to tdor.translivesmatter.info
https://twitter.com/gaytascience/status/1064621338524962817?s=20